gadmSEA: maps of the countries of Southeast Asia.
Contains the countries maps of Southeast Asia from GADM.
Details
Available maps are bhutan, cambodia, china, india, indonesia, laos, malaysia, myanmar, nepal, papuanewguinea, philippines, taiwan, thailand, vietnam.
Examples
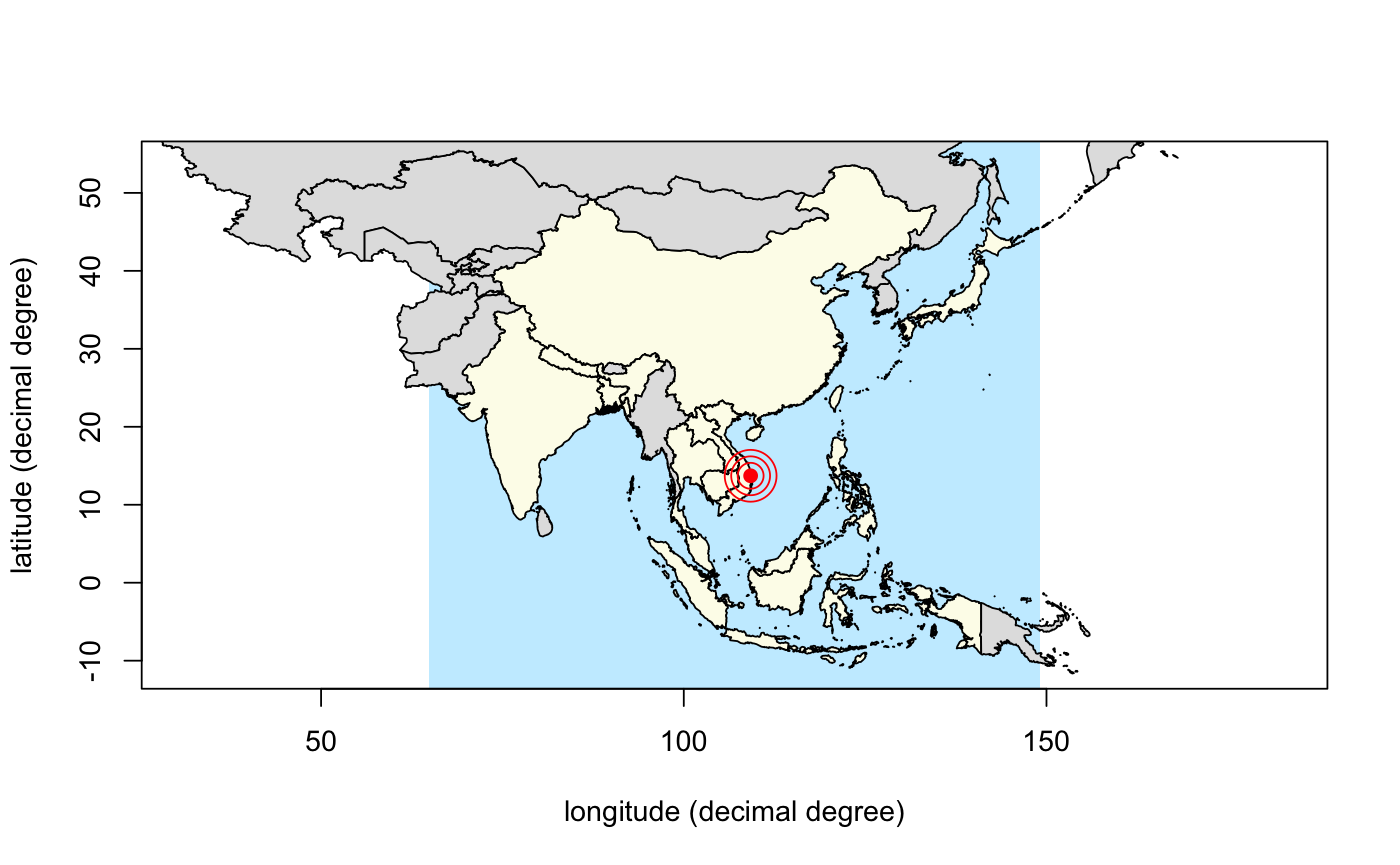
## Plotting Vietnam in Southeast Asia: library(sp) # "plot" library(gadmSEA) # "vietnam" library(dplyr) # "mutate" function and the " %>% " pipe operator#> #>#> #> #>#> #> #>### defining colors: rgb2 <- function(...) rgb(..., max = 255) blue <- rgb2(200, 237, 255) grey <- rgb2(225, 225, 225) yellow <- rgb2(253, 252, 235) ### the map: plot(vietnam, xlab = "longitude (decimal degree)", border = NA, ylab = "latitude (decimal degree)", bg = blue)mcutils::datasets("gadmSEA") %>% as.data.frame(stringsAsFactors = FALSE) %>% setNames("country") %>% mutate(col = ifelse(country == "vietnam", yellow, grey)) %$% invisible(purrr::map2(country, col, ~ plot(get(.x), col = .y, add = TRUE)))#> Error in mcutils::datasets("gadmSEA") %>% as.data.frame(stringsAsFactors = FALSE) %>% setNames("country") %>% mutate(col = ifelse(country == "vietnam", yellow, grey)) %$% invisible(purrr::map2(country, col, ~plot(get(.x), col = .y, add = TRUE))): impossible de trouver la fonction "%$%"axis(1); axis(2); box(bty = "o")## Plotting some countries in southeast Asia: library(sp) # for "plot" library(gadmSEA) # for the countries library(magrittr) # for " %$% " and " %>% " rgb2 <- function(...) rgb(..., max = 255) blue <- rgb2(200, 237, 255) grey <- rgb2(225, 225, 225) yellow <- rgb2(253, 252, 235) ### the map: plot(vietnam, xlab = "longitude (decimal degree)", border = NA, ylab = "latitude (decimal degree)", bg = blue, xlim = c(68, 146), ylim = c(-11, 54))ctr <- c("vietnam", "philippines", "cambodia", "japan", "china", "thailand", "singapore", "indonesia", "malaysia", "taiwan", "bangladesh", "laos", "india", "nepal") mcutils::datasets("gadmSEA") %>% as.data.frame(stringsAsFactors = FALSE) %>% setNames("country") %>% dplyr::mutate(col = ifelse(country %in% ctr, yellow, grey)) %$% invisible(purrr::map2(country, col, ~ plot(get(.x), col = .y, add = TRUE)))axis(1); axis(2); box(bty = "o")points(109.215971, 13.715266, col = "red", pch = 19)points(109.215971, 13.715266, col = "red", cex = 2)points(109.215971, 13.715266, col = "red", cex = 3)points(109.215971, 13.715266, col = "red", cex = 4)