Introduction
Here we show how to compute 2 different measures of elevation by province. The first one is the simple mean of the elevation measures inside the polygon of the province. The second one weights the mean by the local population density. For that, we use the polygons of the country and the provinces from GADM, the SRTM raster elevation data from CGIAR and raster population density data from WorldPop.
Packages
library(sp)
library(raster)
Simple mean
Let’s downlaod the elevation data (751.5 MB) from SRTM:
download.file("http://srtm.csi.cgiar.org/wp-content/uploads/files/srtm_30x30/TIFF/N00E090.zip", "srtm.zip")Let’s unzip it (making a file of 2.4 GB):
unzip("srtm.zip")And load it into R:
srtm <- raster("cut_n00e090.tif")which gives
srtm## class : RasterLayer
## dimensions : 36023, 36023, 1297656529 (nrow, ncol, ncell)
## resolution : 0.0008333334, 0.0008333334 (x, y)
## extent : 89.99042, 120.0096, -0.009583358, 30.00958 (xmin, xmax, ymin, ymax)
## crs : NA
## source : /Users/choisy/Dropbox/aaa/www/blog/content/post/cut_n00e090.tif
## names : cut_n00e090
## values : -32768, 32767 (min, max)Note that the CRS is not defined… However, from here we can see that “The data is projected in a Geographic (Lat/Long) projection, with the WGS84 horizontal datum and the EGM96 vertical datum.” Let’s thus define this projection:
crs(srtm) <- CRS("+init=EPSG:4326")Let’s check:
srtm## class : RasterLayer
## dimensions : 36023, 36023, 1297656529 (nrow, ncol, ncell)
## resolution : 0.0008333334, 0.0008333334 (x, y)
## extent : 89.99042, 120.0096, -0.009583358, 30.00958 (xmin, xmax, ymin, ymax)
## crs : +init=EPSG:4326 +proj=longlat +datum=WGS84 +no_defs +ellps=WGS84 +towgs84=0,0,0
## source : /Users/choisy/Dropbox/aaa/www/blog/content/post/cut_n00e090.tif
## names : cut_n00e090
## values : -32768, 32767 (min, max)We’re good! This file is quite big and we need the data only for Vietnam. We thus want to crop it. For that we need the polygon of Vietnam that we can download from GADM:
download.file("https://biogeo.ucdavis.edu/data/gadm3.6/Rsp/gadm36_VNM_0_sp.rds", "country.rds")Lets load it:
country <- readRDS("country.rds")Which gives:
country## class : SpatialPolygonsDataFrame
## features : 1
## extent : 102.1446, 109.4692, 8.381355, 23.39269 (xmin, xmax, ymin, ymax)
## crs : +proj=longlat +datum=WGS84 +no_defs +ellps=WGS84 +towgs84=0,0,0
## variables : 2
## names : GID_0, NAME_0
## value : VNM, VietnamWe can see that this time the CRS is correctly defined and that it is the same projection as for the SRTM raster file. Let’s plot the elevation data together with the country polygon:
plot(srtm)
plot(country, add = TRUE)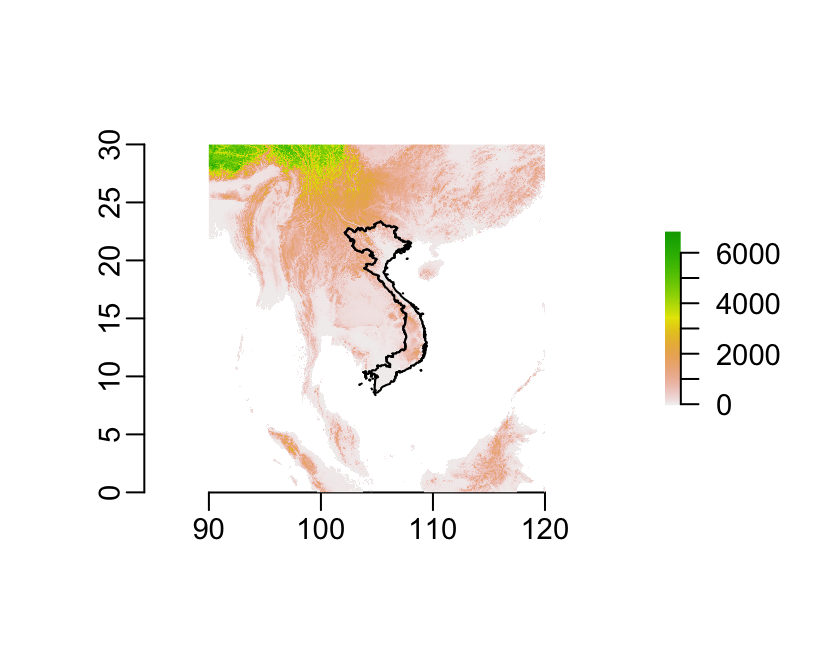
Let’s now use the country polygon to crop the raster file. Note that this can be
done only because the 2 objects have the same projection. If it were not the
case, we would need to reproject one of them according to the projection of the
other, using the sp::spTranform() function. It takes about 15’’.
srtm_cropped <- crop(srtm, country)Let’s write the output to disk:
writeRaster(srtm_cropped, "srtm_cropped.tif")Let’s reload it:
srtm_cropped <- raster("srtm_cropped.tif")Let’s see the result:
plot(srtm_cropped)
plot(country, add = TRUE)
We can see that the cropped_version of the GeoTiff object is reduced from 2.4 GB down to 194.6 MB:
file.size(filename(srtm)) / 2^30## [1] 2.417611and:
file.size(filename(srtm_cropped)) / 2^20## [1] 194.6239Noticing that in this rectangular, we acutally need only a small portion of the pixels, we can go a step further in reducing the data by applying a mask. For that, we first need to create a mask by basically rasterizing the polygon using the same grid as the raster object. Note however that this step takes about 26’, essentially because the size of the polygon is big. Given that, we’ll see at the end of this section that this step is actually not necessary.
country_mask <- rasterize(country, srtm_cropped)Now that the mask is done, we can use it on the cropped raster:
srtm_masked <- mask(srtm_cropped, country_mask)Let’s save to disk and reload:
writeRaster(srtm_masked, "srtm_masked.tif")
srtm_masked <- raster("srtm_masked.tif")
We can see that masking allows to reduce the file size from 195 MB to 86 MB:
file.size(filename(srtm_masked)) / 2^20## [1] 86.16997Let’s see what it looks like:
plot(srtm_masked)
plot(country, add = TRUE)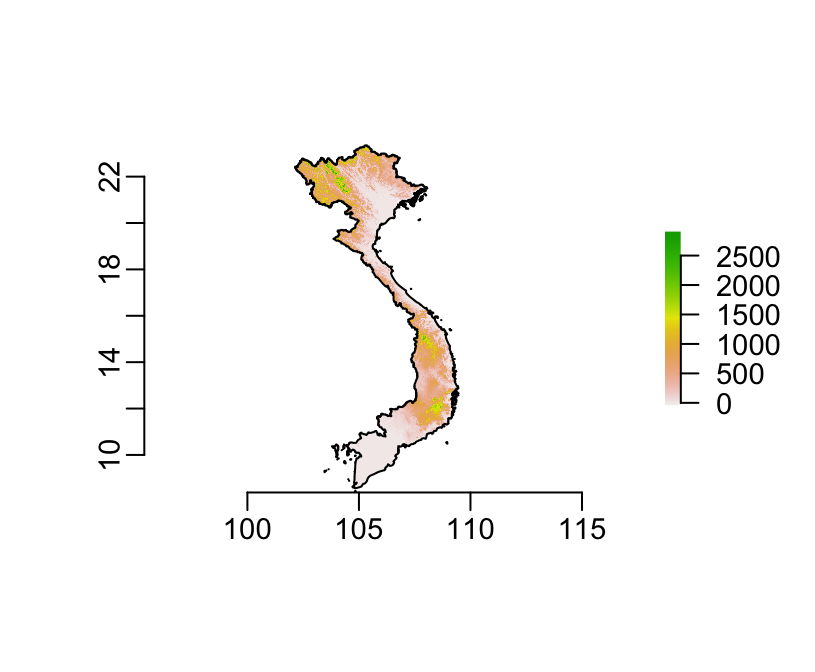
Great! Next step now, in order to compute a value of elevation per province, is to get the polygons of the provinces:
download.file("https://biogeo.ucdavis.edu/data/gadm3.6/Rsp/gadm36_VNM_1_sp.rds", "provinces.rds")Let’s load it:
provinces <- readRDS("provinces.rds")Which gives:
provinces## class : SpatialPolygonsDataFrame
## features : 63
## extent : 102.1446, 109.4692, 8.381355, 23.39269 (xmin, xmax, ymin, ymax)
## crs : +proj=longlat +datum=WGS84 +no_defs +ellps=WGS84 +towgs84=0,0,0
## variables : 10
## names : GID_0, NAME_0, GID_1, NAME_1, VARNAME_1, NL_NAME_1, TYPE_1, ENGTYPE_1, CC_1, HASC_1
## min values : VNM, Vietnam, VNM.1_1, An Giang, An Giang, NA, Thành phố , City, NA, VN.AG
## max values : VNM, Vietnam, VNM.9_1, Yên Bái, Yen Bai, NA, Tỉnh, Province, NA, VN.YBWe can again verify that the projection is the same as the raster and the country polygon. Let’s see what it looks like:
plot(provinces)
What we want to do now is, for each province, extracting the elevation data from the raster file that are inside the polygon of the province and average them. This is what the following function does:
mean_ele <- function(x) {
  require(magrittr)
  prov <- provinces[x, ]
  rast <- crop(srtm_masked, prov) # cropping before the mask
  mask(rast, rasterize(prov, rast)) %>%
    values() %>%
    mean(na.rm = TRUE)
}
Note interestingly that a crop before the mask speeds up the masking by 6.
Interestingly too, this mean_ele() function is about twice as fast as the use
of the extract() function. Compare for example
system.time(opt1 <- sapply(1:3, mean_ele))## user system elapsed
## 37.431 0.508 39.234with
system.time(opt2 <- sapply(extract(srtm_masked, provinces[1:3, ]), mean, na.rm = TRUE))## user system elapsed
## 41.841 7.282 49.593The reason for that is not clear to me. Maybe there are a number of checks in
extract() function that substantially slow everything down. Let’s check that
it provides the same results however:
opt1 - opt2## [1] 0 0 0Let’s also see what is the benefit of working on strm_masked instead of
strm_cropped:
mean_ele2 <- function(x) {
  require(magrittr)
  prov <- provinces[x, ]
  rast <- crop(srtm_cropped, prov)
  mask(rast, rasterize(prov, rast)) %>%
    values() %>%
    mean(na.rm = TRUE)
}
system.time(opt3 <- lapply(1:3, mean_ele2))
## user system elapsed
## 26.341 0.263 27.171So, it means that the only advantage of the srtm_masked over srtm_cropped is
that it’s about twice as light on the disk but it doesn’t make the calculations
based on these rasters any faster. Good to know! Let’s now compute this for all
the provinces, which takes about 10’:
elevations1 <- sapply(seq_along(provinces), mean_ele)Weighting by population densities
Now, let’s consider an alternative way of computing these elevations by province, weighting them by the local population density. We can retrieve the local population density for Vietnam as a raster file from WorldPop:
download.file("ftp://ftp.worldpop.org.uk/GIS/Population/Global_2000_2020/2010/VNM/vnm_ppp_2010.tif", "worldpop.tif")Let’s load it:
worldpop <- raster("worldpop.tif")Good news here is that the raster is already masked:
plot(worldpop)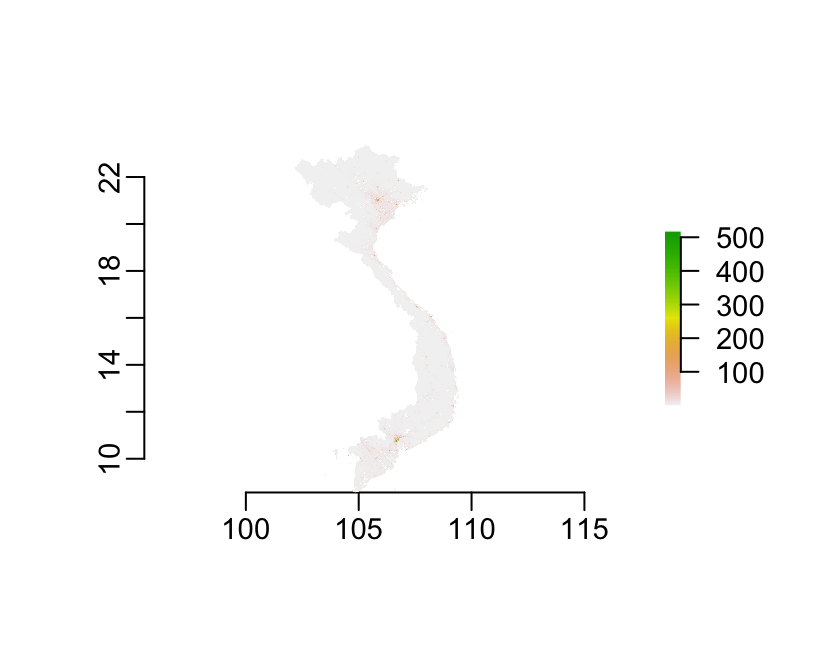
It also has the same projection than the other objects we’ve been dealing with so far:
worldpop## class : RasterLayer
## dimensions : 17796, 8789, 156409044 (nrow, ncol, ncell)
## resolution : 0.0008333333, 0.0008333333 (x, y)
## extent : 102.1454, 109.4696, 8.562917, 23.39292 (xmin, xmax, ymin, ymax)
## crs : +proj=longlat +datum=WGS84 +no_defs +ellps=WGS84 +towgs84=0,0,0
## source : /Users/choisy/Dropbox/aaa/www/blog/content/post/worldpop.tif
## names : worldpop
## values : 0.02010591, 568.1513 (min, max)Of note too, it has the same resolution as srtm_masked, but not quite the same
grid definition though:
srtm_masked## class : RasterLayer
## dimensions : 18014, 8790, 158343060 (nrow, ncol, ncell)
## resolution : 0.0008333334, 0.0008333334 (x, y)
## extent : 102.1446, 109.4696, 8.38125, 23.39292 (xmin, xmax, ymin, ymax)
## crs : +proj=longlat +datum=WGS84 +no_defs +ellps=WGS84 +towgs84=0,0,0
## source : /Users/choisy/Dropbox/aaa/www/blog/content/post/srtm_masked.tif
## names : srtm_masked
## values : -129, 3106 (min, max)In order to be able to weigth the elevation data from srtm_masked by the
population density data from worldpop we need to ensure that the two rasters
use the same grid. This implies resampling one of the raster on the grid of the
other one. Let’s resample srtm_masked on worldpop. It takes about 2’:
srtm_masked2 <- resample(srtm_masked, worldpop)We can check that it worked:
worldpop## class : RasterLayer
## dimensions : 17796, 8789, 156409044 (nrow, ncol, ncell)
## resolution : 0.0008333333, 0.0008333333 (x, y)
## extent : 102.1454, 109.4696, 8.562917, 23.39292 (xmin, xmax, ymin, ymax)
## crs : +proj=longlat +datum=WGS84 +no_defs +ellps=WGS84 +towgs84=0,0,0
## source : /Users/choisy/Dropbox/aaa/www/blog/content/post/worldpop.tif
## names : worldpop
## values : 0.02010591, 568.1513 (min, max)and:
srtm_masked2## class : RasterLayer
## dimensions : 17796, 8789, 156409044 (nrow, ncol, ncell)
## resolution : 0.0008333333, 0.0008333333 (x, y)
## extent : 102.1454, 109.4696, 8.562917, 23.39292 (xmin, xmax, ymin, ymax)
## crs : +proj=longlat +datum=WGS84 +no_defs +ellps=WGS84 +towgs84=0,0,0
## source : /private/var/folders/0z/99v2vkd57yd4h_wwxbzqm2lm0000gn/T/RtmpKLImwn/raster/r_tmp_2019-10-24_182415_9898_99280.grd
## names : srtm_masked
## values : -128.7624, 3105.94 (min, max)Below is a new version of the mean_ele() function that performs the population
weighting:
mean_ele3 <- function(x) {
  prov <- provinces[x, ]
  srtm <- crop(srtm_masked2, prov)
  wpop <- crop(worldpop, prov)
  prov_mask <- rasterize(prov, srtm)
  srtm_val <- values(mask(srtm, prov_mask))
  wpop_val <- values(mask(wpop, prov_mask))
  weights <- wpop_val / sum(wpop_val, na.rm = TRUE)
  sum(weights * srtm_val, na.rm = TRUE)
}
Let’s apply it to all the provinces, it takes about 16’:
elevations2 <- sapply(seq_along(provinces), mean_ele3)Let’s compare the 2 measures of elevation by province:
(elevations <- data.frame(province = provinces$VARNAME_1, elevations1, elevations2))## province elevations1 elevations2
## 1 An Giang 8.898235 6.408292
## 2 Bac Lieu 1.695055 1.881781
## 3 Bac Giang 106.352667 29.775390
## 4 Bac Kan 490.829030 394.819273
## 5 Bac Ninh 6.222558 7.070005
## 6 Ben Tre 2.076570 2.810856
## 7 Ba Ria - Vung Tau 58.798530 30.709794
## 8 Binh Dinh 264.440442 51.091846
## 9 Binh Duong 38.621079 25.638468
## 10 Binh Phuoc 176.327987 145.018136
## 11 Binh Thuan 217.787158 72.584621
## 12 Can Tho 2.663051 3.144337
## 13 Ca Mau 2.131124 2.131788
## 14 Cao Bang 617.552520 514.365906
## 15 Dak Lak 502.929377 494.978901
## 16 Dak Nong 635.457842 597.524631
## 17 Dong Nai 102.931787 71.755471
## 18 Dong Thap 3.443112 4.442910
## 19 Da Nang 276.254180 26.729688
## 20 Dien Bien 898.531873 734.174963
## 21 Gia Lai 526.389724 505.270508
## 22 Hai Duong 10.678064 5.502737
## 23 Hai Phong 13.913417 5.799682
## 24 Hau Giang 1.672961 1.840450
## 25 Ho Chi Minh 5.020083 6.362934
## 26 Ha Giang 718.742222 639.124498
## 27 Ha Noi 25.105430 12.541751
## 28 Ha Nam 21.396139 10.562716
## 29 Ha Tinh 173.831383 35.958710
## 30 Hoa Binh 315.397034 174.539607
## 31 Hung Yen 5.293893 5.748083
## 32 Khanh Hoa 381.844209 68.901831
## 33 Kien Giang 10.164205 6.650253
## 34 Kon Tum 887.268424 693.869140
## 35 Lang Son 349.812444 285.813686
## 36 Lai Chau 1000.487861 804.993577
## 37 Lam Dong 911.213147 944.541232
## 38 Lao Cai 828.443694 506.560942
## 39 Long An 2.094010 2.222340
## 40 Nam Dinh 2.727538 3.115513
## 41 Nghe An 393.868204 81.151246
## 42 Ninh Binh 49.014519 13.659144
## 43 Ninh Thuan 354.701355 70.047739
## 44 Phu Tho 146.158709 55.094982
## 45 Phu Yen 258.861542 68.853622
## 46 Quang Binh 287.294469 75.554779
## 47 Quang Nam 464.724461 84.292007
## 48 Quang Ngai 283.743576 56.648166
## 49 Quang Ninh 168.250187 52.426892
## 50 Quang Tri 256.356000 82.139390
## 51 Soc Trang 1.734239 2.184876
## 52 Son La 828.559643 680.606294
## 53 Tay Ninh 23.078405 16.178220
## 54 Thua Thien Hue 301.140207 51.183379
## 55 Thai Binh 2.502572 2.757502
## 56 Thai Nguyen 162.562823 68.150190
## 57 Thanh Hoa 255.976636 51.144353
## 58 Tien Giang 2.361345 2.928570
## 59 Tra Vinh 2.026229 2.653617
## 60 Tuyen Quang 284.681424 133.301032
## 61 Vinh Long 1.778635 2.182872
## 62 Vinh Phuc 96.040181 28.194070
## 63 Yen Bai 666.156834 314.113652Let’s visualize this:
plot(elevations2 ~ elevations1, elevations, xlab = "weighted by population density", ylab = "non weighted", col = "blue")
abline(0, 1)
This figure shows clearly that the population tends to gather in the lower parts of the province.