Weather variables such as temperature, humidity, rainfall, etc… are collected from climatic stations. These data are thus available from points in space whereas we often need them to be representative of administrative units (e.g. provinces) which are polygons. A strategy to transform points data into polygons data is to perform interpolation of points data onto a grid and then aggregation of grid data into polygons, as illustrated on the figure below:
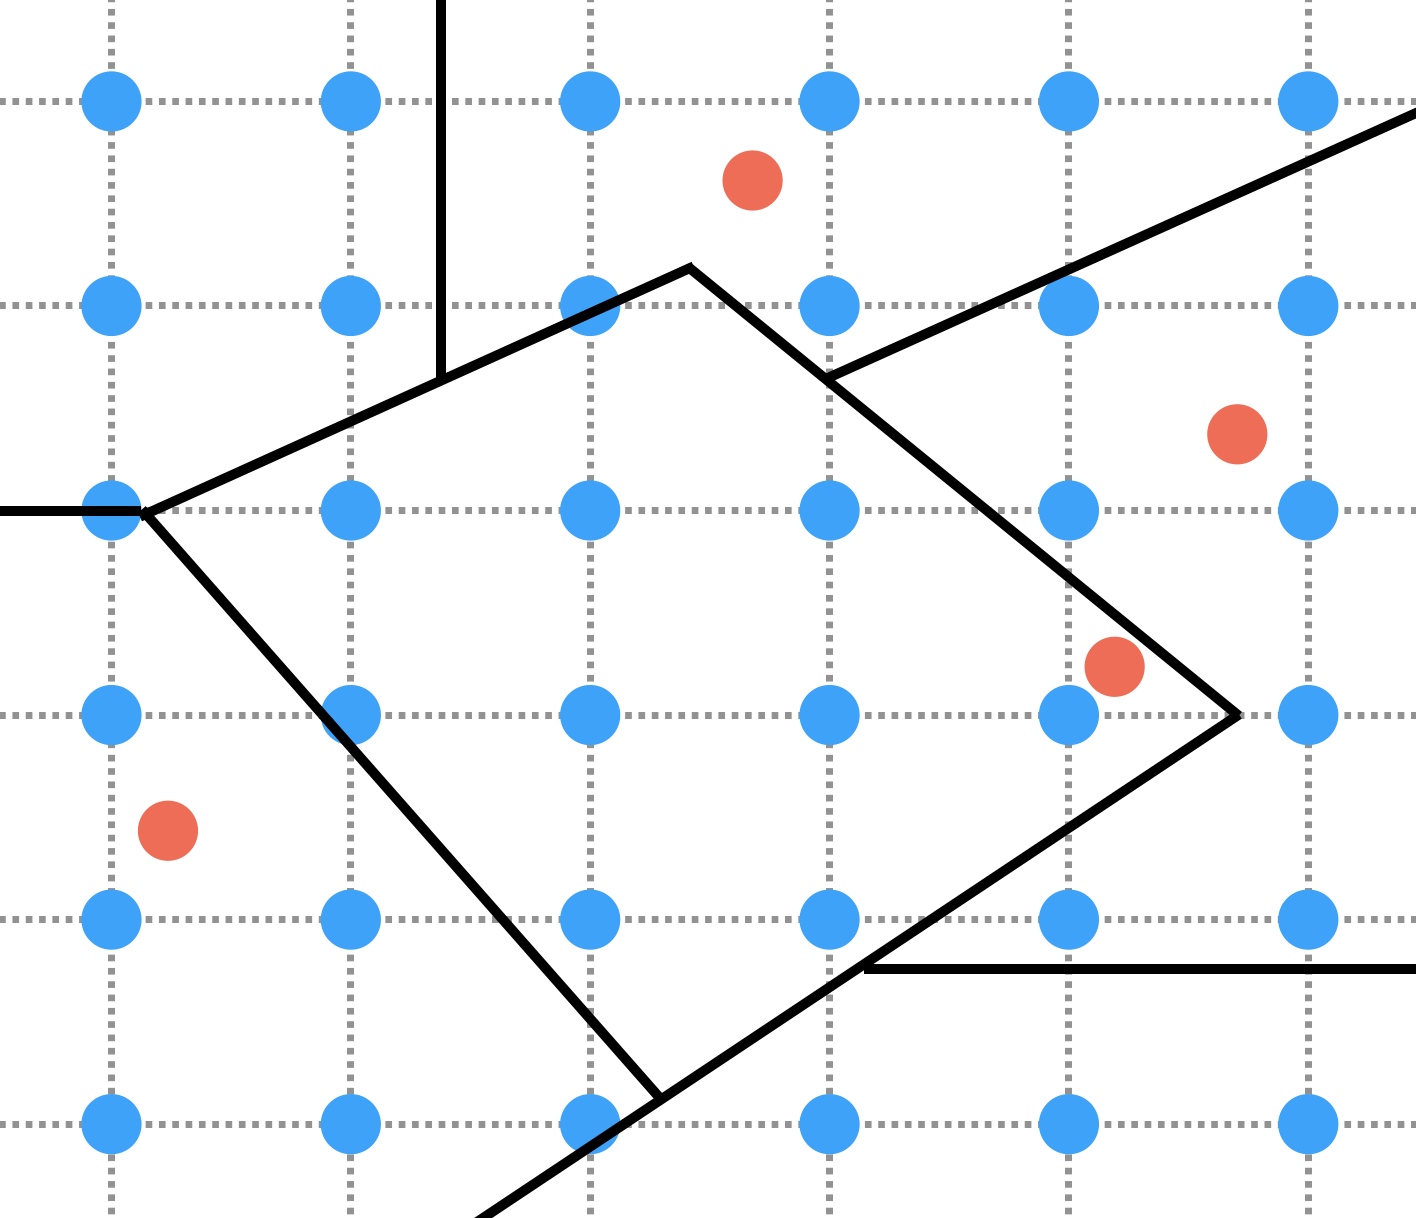
On this figure, 4 climatic stations are represented by red dots. Interpolation consists in using data from these red dot climatic stations to compute values on blue nodes of the grid. Aggregation then consists in using the data from the blue nodes inside a given polygon to compute variables that are representative of this polygon. In practice, both the interpolation and the aggregation steps can be performed by a number of different algorithms. One common algorithm used for spatial interpolation is kriging that we will consider here. A simple way to perform aggregation is to consider the mean of the values of the blue nodes inside a polygon. This produces a value that is representative of the polygon as a geometric object. However, when we consider provinces as spatial units in epidemiology, what we often want our variables to be representative of is more the population living inside the province polygon than the province polygon as a geometric object. A way to do so when computing the aggregated variables, is to weight the data from each blue node using a measure of population size inside the green square around that blue node, as illustrated on the figure below where the sizes of the blue node represent the population weights:

This is now possible thanks to the WorldPop project that provides population sizes per pixels for a large number of countries around the world. An obvious way to compute weights from these pixel-based population data is to divide the population size in each pixel by the sum of the population sizes of all the pixels inside the same polygon. This way, we ensure that the weights of all the pixels of a given polygon sum to 1. They thus reflect where the population of a given province mostly live. In this post we will show how to perform so in R, using Vietnam as an example.
Packages
We will need the following packages:
# install.package(c("parallel", "devtools", "sf", "sp", "raster", "tidyr", "dplyr", "purrr", "automap"))
# devtools::install_github(paste0("choisy/", c("imhen", "srtmVN", "mcutils", "sptools", "worldpopVN")))
library(sf)      # as
library(sp)      # proj4string, plot, coordinates, merge
library(raster)  # plot, overlay, values
library(sptools) # gadm, make_grid, add_from_raster, add_variable_spdf,
                 # na_exclude, change_data, apply_pts_by_poly, grid2raster,
                 # split_on_poly, resample_from_grid, rescale_raster
library(mcutils) # ovv
library(tidyr)   # gather, separate, spread
library(dplyr)   # select, filter, arrange, mutate, mutate_at, mutate_if
Note that it is good practice to load dplyr the last, in order to avoid
name conflicts with other packages, such as select() of the raster package.
The data
Climatic data
The climatic data are available by month for 67 climatic stations accross Vietnam
from the
Institute of Hydrology, Meteorology Science and Climate Change
of Vietnam and packaged in the imhen R
package:
meteo <- imhen::meteofor the climatic data that look like
ovv(meteo)## year month station Ta Tx Tm Rf rH Sh aH
## 1 1961 January Bac Kan 13.9 19.1 10.5 5.3 82 <NA> 13.1
## 2 1961 February Bac Kan 15.1 18.3 13.2 21.5 85 <NA> 14.7
## 3 1961 March Bac Kan 19.6 23.2 17.5 85.4 87 <NA> 20.1
## 4 1961 April Bac Kan 23.5 28.1 20.5 185.8 87 <NA> 24.8
## 5 1961 May Bac Kan 25.8 31.2 22.1 34.9 83 <NA> 27.1
## 6 1961 June Bac Kan 26.9 32.6 23.1 314.7 83 <NA> 29.3
## . . . . . . . . . . .
## . . . . . . . . . . .
## . . . . . . . . . . .
## 37843 2017 July Cang Long 26.9 31.9 24.22 225.5 87 152 31.9
## 37844 2017 August Cang Long 27.2 32.4 24.77 379.1 87 185.2 32.4
## 37845 2017 September Cang Long 27.6 33 24.88 248.5 85 186.8 33
## 37846 2017 October Cang Long 27.1 32.2 24.45 231.5 87 149.2 32.2
## 37847 2017 November Cang Long 27.2 31.7 24.57 89.5 87 174.4 31.7
## 37848 2017 December Cang Long 25.8 30.6 23.02 107 84 169.3 30.6and
stations <- as(imhen::stations, "Spatial")for the stations and their elevations, which look like
ovv(stations)## coordinates station elevation
## 1 (105.8167, 22.1333) Bac Kan 174 [m]
## 2 (106.2, 21.2833) Bac Giang 7 [m]
## 3 (105.7167, 9.2833) Bac Lieu 2 [m]
## 4 (106.05, 21.2) Bac Ninh 5 [m]
## 5 (106.6, 10.0333) Ba Tri 12 [m]
## 6 (106.4, 21.0833) Ba Vi 20 [m]
## . . . .
## . . . .
## . . . .
## 62 (105.4167, 21.3) Viet Tri 17 [m]
## 63 (105.6667, 18.6667) Vinh 6 [m]
## 64 (105.6, 21.3) Vinh Yen 10 [m]
## 65 (107.0833, 10.3333) Vung Tau 4 [m]
## 66 (107.2333, 10.95) Xuan Loc 17 [m]
## 67 (104.8667, 21.7) Yen Bai 56 [m]Note that stations is not projected:
proj4string(stations)## [1] "+proj=longlat +datum=WGS84 +no_defs +ellps=WGS84 +towgs84=0,0,0"Geographical data
The grid on which the interpolation will be performed will be generated from the polygon of the whole country that can be obtained from GADM (takes about 5’’ to download):
country <- gadm("vietnam", "sp", 0)And the polygons of the provinces of Vietnam needed for the aggregation step can also be obtained from GADM (takes about 5’’ to download):
provinces <- gadm("vietnam", "sp", 1)None of these polygons are projected:
proj4string(country)## [1] "+proj=longlat +datum=WGS84 +no_defs +ellps=WGS84 +towgs84=0,0,0"proj4string(provinces)## [1] "+proj=longlat +datum=WGS84 +no_defs +ellps=WGS84 +towgs84=0,0,0"Here is the country polygon together with the locations of the climatic stations (takes about 6’’ on a MacBook Pro):
plot(country)
plot(stations, add = TRUE, col = "red")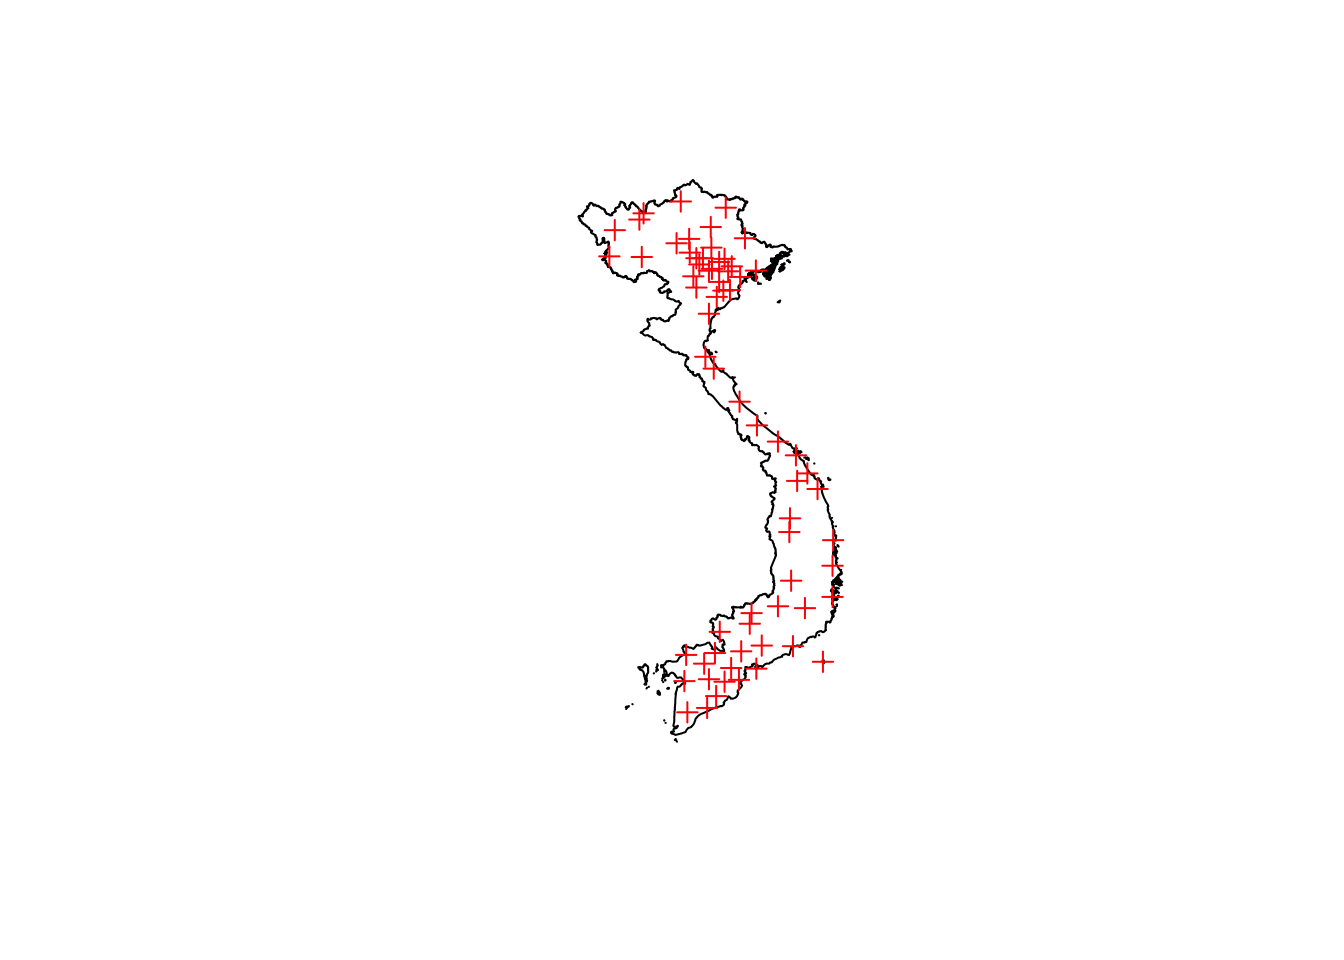
And here are the polygons the of the provinces (takes about 7’’):
plot(provinces)
Elevation data
In order to improve performance, the spatial interpolation will be performed
using latitude and elevation as covariables. Elevation data can be retrieved
from the SRTM project (vertical error reported to
be less than 16 m). The data for Vietnam from that project are available from
the srtmVN R package (takes about 45’’
to download the ca 100 MB of data if they are not on disk):
elevation <- srtmVN::getsrtm()Note that elevation is not projected either:
proj4string(elevation)## [1] "+proj=longlat +datum=WGS84 +no_defs +ellps=WGS84 +towgs84=0,0,0"And the data look like this (takes about 20’’ on a MacBook Pro):
plot(elevation)
Population density data
Finally, the population data that we will use for the aggregation are from the
WorldPop project that can be accessed directly
from the worldpopVN R package (takes
about 1’30’’ to download the 600 MB of data if they are not on disk):
popdensity <- worldpopVN::getpop()These data are not not projected either:
proj4string(popdensity)## [1] "+proj=longlat +datum=WGS84 +no_defs +ellps=WGS84 +towgs84=0,0,0"and look like this:
plot(popdensity)
In the next 2 sections, we’ll show the details of the interpolation and aggregation steps respectively. Note that these two steps are applied to a given climatic variable on a given month (of a given year). In the last section, we’ll show how to assemble these 2 steps into a pipeline that
- splits the data by climatic variable and month;
- applies interpolation and aggregation on a given variable and a given month;
- combines the results and puts them into shape.
Interpolation
As explained above, the first step of the algorithm is interpolation of the
data collected from climatic stations (points) onto a grid (i.e. a collection
of points regularly spaced). For that we thus need to generate a grid.
Furthermore, as explained above too, in order to improve the performance of the
interpolation, we will consider latitude and elevation as covariables and these
variables thus need to be added to the grid. The following function makes a grid
of approximately n cells from a SpatialPolygons* plgn with the latitude
and the variable var of the Raster* rstr as covariables:
make_grid <- function(plgn, rstr, var, n, ...) {
  require(magrittr) # %>%
  plgn %>%
    sptools::make_grid(n, ...) %>%
    sptools::add_from_raster(rstr, var) %>%
    sptools::add_variable_spdf(., data.frame(latitude = coordinates(.)[, 2]))
}
Let’s use this function to generate a grid of approximately 10,000 cells inside Vietnam. It takes about 20’’ on a MacBook Pro:
grid <- make_grid(country, elevation, "elevation", 10000)We can check that there are approximately 10,000 cells:
length(grid)## [1] 9960Next, we need a function that takes data of one given climatic variable from a given month together with a grid as inputs and returns the interpolated values of the data on the grid. The following function is one option for such a function, using kriging:
kriging <- function(points, grid, formula, proj) {
  require(magrittr) # %>%
  points %>%
    sptools::na_exclude() %>%
    sp::spTransform(proj) %>%
    automap::autoKrige(formula, ., sp::spTransform(grid, proj)) %>%
    `$`("krige_output") %>%
    slot("data") %>%
    dplyr::transmute(interpolated = var1.pred) %>%
    sptools::change_data(grid, .)
}
Note that this function is based on the use of the autoKrige() function of the
automap package, which is itself a wrapper around the variogram(),
fit.variogram() and krige() functions of the gstat package in order to
automate the tuning of hyperparamters when estimating the variogram (see
here for more details). Note also that we
remove observations that contains missing values and that we project the data
and the grid as required by the autoKrige() function. To use the function
kriging we first need to
- select a given climatic variable of a given month and
- spatialise these data by merging it with the
stationsobject
Of note, since we are using latitude as a covariable in the kriging process, it
means that we also need to add this variable to the stations object:
stations$latitude <- coordinates(stations)[, 2]Let’s consider the average temperature Ta for the month of December 2017 as an
example. As a projection, we will consider the following
Universal Transverse Mercator (UTM) projection using the
World Geodesic System 84
(WGS84) (with units in meters):
projVN <- "+init=epsg:3405"See spatialreference.org for more information. And here is the interpolation:
interpolated <- meteo %>%
  filter(year == 2017, month == "December") %>%
  dplyr::select(year, month, station, Ta) %>%
  merge(stations, .) %>%
  kriging(grid, Ta ~ latitude + elevation, projVN)
## [using universal kriging]Which looks like this:
interpolated## class : SpatialPointsDataFrame
## features : 9960
## extent : 102.147, 109.408, 8.567, 23.354 (xmin, xmax, ymin, ymax)
## coord. ref. : +proj=longlat +datum=WGS84 +no_defs +ellps=WGS84 +towgs84=0,0,0
## variables : 1
## names : interpolated
## min values : 2.87390840770085
## max values : 26.6700709969568Aggregation
Now that the interpolation is done, the next step is to perform aggregation.
For that, we need a function that takes as inputs a grid with interpolated
values together with a collection of polygons (a SpatialPolygons* object) and
returns aggregated values by polygons. A simple option would be to average
the interpolated values inside each polygon, which could be done by the following
function:
simple_aggregation <- function(grid, polygons, var) {
  sptools::apply_pts_by_poly(grid, polygons, var, mean, na.rm = TRUE)
}
Let’s try it:
(s_agg <- simple_aggregation(interpolated, provinces, "interpolated"))## [1] 25.93446 26.04513 16.37803 13.91497 17.22584 26.26648 25.93565
## [8] 22.37615 25.95628 24.69194 24.55899 26.02082 26.26159 12.79533
## [15] 21.78786 21.38466 25.47922 26.11343 19.61694 14.05632 21.36618
## [22] 17.33222 17.39876 26.00603 26.31961 13.03891 17.29055 17.51367
## [29] 17.72161 15.99220 17.43528 22.75916 25.88807 18.41101 14.56623
## [36] 12.92194 20.16097 13.18322 26.30016 17.77942 16.22080 17.46464
## [43] 23.07825 16.71103 22.96588 17.74512 19.12346 21.27914 16.17810
## [50] 18.63938 26.03440 13.92168 25.96282 18.95489 17.67058 16.02705
## [57] 16.53647 26.29503 26.14750 15.48116 26.14229 16.82875 13.94836As explained above, a more sophisticated approach is to incorporate weights on the nodes of the grid when doing so. This is particularly relevant in epidemiology where we may want to weight the interpolated values of the grid using the population size on the nodes of the grid. This is what the following function does:
weighted_aggregation <- function(grid, polygons, weights) {
  require(magrittr)  # %>%
  grid %>%
    sptools::grid2raster() %>%
    sptools::split_on_poly(polygons) %>%
    purrr::map2(weights, raster::overlay, fun = function(x, y) x * y) %>%
    sapply(. %>%     # this could potentially be parallelized.
             raster::values() %>%
             sum(na.rm = TRUE))
}
Note that we could have parallelized the sapply() call but we chose not to
since, ultimately, in the pipeline below, the weighted_aggregation() call will be
inserted into a parallelized loop anyway (the loop over climatic variables and
months). It appears that to use this function we need to compute the weights.
The following function computes weights by polygons of the plgns
SpatialPolygons* object from the data of the rstr Raster* object and using
a grid grid (SpatialPoints* object):
make_weights <- function(rstr, grid, plgns) {
  require(magrittr) # %>%
  rstr %>%
    sptools::resample_from_grid(grid) %>%
    sptools::split_on_poly(plgns) %>%
    parallel::mclapply(sptools::rescale_raster)
}
Computing weights using the above-computed grid of 10,000 nodes takes about
2’30’’ on a MacBook Pro:
weights <- make_weights(popdensity, grid, provinces)Now that we have our weigths, we can perform our weighted aggregation:
(w_agg <- weighted_aggregation(interpolated, provinces, weights))## [1] 25.96215 26.04504 16.83787 14.16452 17.22713 26.26703 26.11684
## [8] 22.12815 26.08814 24.94950 24.52840 26.03617 26.12308 12.99800
## [15] 21.93697 21.58603 25.80557 26.10208 20.93347 14.80147 21.46786
## [22] 17.35435 16.95179 26.01195 26.02648 13.40478 17.31724 17.56356
## [29] 18.43876 16.54491 17.43198 22.48198 25.92681 19.68005 14.86321
## [36] 13.54493 19.29531 14.73254 26.32777 17.77065 17.85537 17.70693
## [43] 24.72106 17.09754 23.29945 18.81187 20.54268 22.34409 16.28708
## [50] 19.56073 26.03718 14.45972 26.04695 18.88305 17.50696 16.58848
## [57] 17.60690 26.04396 24.75633 16.25531 26.13346 17.14555 15.70117Let’s compare these 2 options of aggregation:
plot(w_agg, s_agg, xlab = "weighted aggregation", ylab = "simple aggregation")
abline(0, 1)
which suggests, not surprisingly, that simple aggregation likely underestimates the temperature at the province level.
Pipeline
Now that we have seen how to apply interpolation and aggregation on one given variable of a given month, we can insert these two steps into a pipeline that does interpolation-aggregation on all the variables and all the months. The pipeline will thus have 3 sections:
- the first section will split the data by variable and month;
- the second section will apply interpolation-aggregation to each variable-month combination (this step will be parallelized);
- the third section will combine back all the results in the form of a data frame.
In order to make this pipeline as flexible as possible, let’s consider the following function
make_2arg_fct <- function(f, ...) {
  function(x, y) {
    f(x, y, ...)
  }
}
that we will use to create 2-argument functions for the interpolation and aggregation steps. For example, we can create a 2-argument interpolation function as so:
interpolation <- make_2arg_fct(kriging, value ~ latitude + elevation, projVN)Note here that the formula is value ~ latitude + elevation and not
Ta ~ latitude + elevation as above. This is because, in the pipeline, the
interpolation step will be inserted into a loop over all the climatic variables.
Thus the RHS of the formula will have to change depending on the climatic
variable under consideration. The trick we chose to manage this issue is to always
call the RHS of the formula simply value, which is anyway very easy to specify so
with the gather() call that precedes the interpolation call in the pipeline.
Similarly, from what we’ve seen above, we can make a 2-argument aggregation
function as so:
aggregation <- make_2arg_fct(simple_aggregation, "interpolated")or
aggregation <- make_2arg_fct(weighted_aggregation, weights)Below is an example of the pipeline applied to all the climatic variables of the last 2 months of 2017 (takes about 35’’ on a MacBook Pro):
out <- meteo %>%
  filter(year == 2017, month %in% c("November", "December")) %>%
#  filter(year == 2017) %>%
  mutate_if(is.factor, as.character) %>%
# I. Prepare the data ----------------------------------------------------------
  gather(variable, value, -year, -month, -station) %>% # defining "variable" and "value"
  split(list(.$variable, .$year, .$month)) %>%  # A. SPLIT  ### 0.28
# II. For each month and variable ----------------------------------------------
  parallel::mclapply(. %>%                      # B. APPLY
                       merge(stations, .) %>%       # (1) spatialize data  ### 0.152
                       interpolation(grid) %>%      # (2) spatial interpolation ### 24.900
                       aggregation(provinces)) %>%  # (3) spatial aggregation ### 401.247
# III. Put results into shape --------------------------------------------------
  data.frame() %>%                              # C. COMBINE
  cbind(province = provinces$VARNAME_1, .) %>%
  gather("key", "value", -province) %>%
  separate(key, c("variable", "year", "month")) %>%
  spread(variable, value) %>%
  mutate(year  = as.integer(year),
         month = factor(month, month.name, ordered = TRUE)) %>%
  arrange(year, province, month)       ### 446.544
Note: for a full year, it takes about 4’. Most of the time (92 %) is taken by the aggregation step. Interpolation takes 7 % of the time and the rest (1 %) is taken by data preparation (including split and merge) and combine step and data reshaping.
The merge() call is here included inside the loop but note that, in principle,
it could have been included outside the loop. The reason we included it inside
the loop is because it’s more efficient memory-wise this way. Note also that our
strategy here is to use the
split-apply-combine scheme
which offers the advantage that the apply step be easily parallelized with the
mclapply() function of the parallel package. This function is not working on
Windows though so Windows user will either have to use the base::apply()
function instead or to parallelize the code by other means that are Windows
compliant (for example parallel::parLapply()). The group_by()-mutate()-ungroup() from the
dplyr package applies the
split-apply-combine strategy
to a data frame. Feel free to try it here. Note also that the
multidplyr package offers ways to
parallelize this. One option in particular is simply to replace
dplyr::group_by() by multidplyr::partition() and dplyr::ungroup() by
multidplyr::collect(). There are other options where the user can finely
manage the clusters. Feel free to try this too. See
here
for more information on the multidplyr package.
Post-calculation checks
Since there is no constraint in the interpolation algorithm, it’s possible that the pipeline produces aberrant values such as negative humidities or relative humidities above 100. Luckily this happens quite rarely. But, still, these mistakes need to be fixed:
out2 <- out %>%
  mutate(rH = ifelse(rH > 100, 100, rH)) %>%
  mutate_at(vars(aH, rH, Rf, Sh), funs(ifelse(. < 0, 0, .)))
It appears that rainfall is a variable particularly difficult to interpolate. One reason for that is that this variable varies a lot in space and that our network climatic stations contains too few of them to render such a variation. In such conditions, the best we can do is look for outliers among the interpolated-aggregated rainfall values, replace them by missing values and perform missing values inputation to replace them. This will be the topic of another post.
A script
Below we put together a script that could be run independently. This script is
used to generate the meteo_intagg_2008_2017 data frame of the
imhen package.
# Parameters -------------------------------------------------------------------
proj <- "+init=epsg:3405"
nbcells <- 10000
kriging_model <- value ~ latitude + elevation
weighted <- TRUE


# The packages -----------------------------------------------------------------
installed <- row.names(installed.packages())
cran <- c("automap", "devtools", "parallel", "purrr", "sf", "sp", "raster", "tidyr", "dplyr")
gh <- paste0("choisy/", c("imhen", "srtmVN", "mcutils", "sptools", "worldpopVN"))
cran2 <- setdiff(cran, installed)
gh2 <- setdiff(gh, installed)
if (length(cran2) > 0) install.packages(cran2)
if (length(gh2) > 0) devtools::install_github(gh2)
lapply(c("sf", "sp", "raster", "sptools", "mcutils", "tidyr", "dplyr"), library, character.only = TRUE)


# The data ---------------------------------------------------------------------
obj <- ls()
if (! "meteo" %in% obj) meteo <- imhen::meteo
if (! "stations" %in% obj) {
  stations <- as(imhen::stations, "Spatial")
  stations$latitude <- coordinates(stations)[, 2]
}
if (! "country" %in% obj) country <- gadm("vietnam", "sp", 0)
if (! "provinces" %in% obj) provinces <- gadm("vietnam", "sp", 1)
if (! "elevation" %in% obj) elevation <- srtmVN::getsrtm()
if (! "popdensity" %in% obj) popdensity <- worldpopVN::getpop()


# Utilitary functions ----------------------------------------------------------
make_grid <- function(plgn, rstr, var, n, ...) {
  require(magrittr) # %>%
  plgn %>%
    sptools::make_grid(n, ...) %>%
    sptools::add_from_raster(rstr, var) %>%
    sptools::add_variable_spdf(., data.frame(latitude = coordinates(.)[, 2]))
}

make_weights <- function(rstr, grid, plgns) {
  require(magrittr) # %>%
  rstr %>%
    sptools::resample_from_grid(grid) %>%
    sptools::split_on_poly(plgns) %>%
    parallel::mclapply(sptools::rescale_raster)
}

make_2arg_fct <- function(f, ...) {
  function(x, y) {
    f(x, y, ...)
  }
}

kriging <- function(points, grid, formula, proj) {
  require(magrittr) # %>%
  points %>%
    sptools::na_exclude() %>%
    sp::spTransform(proj) %>%
    automap::autoKrige(formula, ., sp::spTransform(grid, proj)) %>%
    `$`("krige_output") %>%
    slot("data") %>%
    dplyr::transmute(interpolated = var1.pred) %>%
    sptools::change_data(grid, .)
}

simple_aggregation <- function(grid, polygons, var) {
  sptools::apply_pts_by_poly(grid, polygons, var, mean, na.rm = TRUE)
}

weighted_aggregation <- function(grid, polygons, weights) {
  require(magrittr)  # %>%
  grid %>%
    sptools::grid2raster() %>%
    sptools::split_on_poly(polygons) %>%
    purrr::map2(weights, raster::overlay, fun = function(x, y) x * y) %>%
    sapply(. %>%     # this could potentially be parallelized.
             raster::values() %>%
             sum(na.rm = TRUE))
}


# Preparing --------------------------------------------------------------------
grid <- make_grid(country, elevation, "elevation", nbcells)
weights <- make_weights(popdensity, grid, provinces)
interpolation <- make_2arg_fct(kriging, kriging_model, proj)
if (weighted) {
  aggregation <- make_2arg_fct(weighted_aggregation, weights)
} else aggregation <- make_2arg_fct(simple_aggregation, "interpolated")


# Calculations -----------------------------------------------------------------
out <- meteo %>%
  mutate_if(is.factor, as.character) %>%
# I. Prepare the data ----------------------------------------------------------
  gather(variable, value, -year, -month, -station) %>% # defining "variable" and "value"
  split(list(.$variable, .$year, .$month)) %>%
# II. For each month and variable ----------------------------------------------
  parallel::mclapply(. %>%
                       merge(stations, .) %>%       # (1) spatialize data
                       interpolation(grid) %>%      # (2) spatial interpolation
                       aggregation(provinces)) %>%  # (3) spatial aggregation
# III. Put results into shape --------------------------------------------------
  data.frame() %>%
  cbind(province = provinces$VARNAME_1, .) %>%
  gather("key", "value", -province) %>%
  separate(key, c("variable", "year", "month")) %>%
  spread(variable, value) %>%
  mutate(year  = as.integer(year),
         month = factor(month, month.name, ordered = TRUE)) %>%
  arrange(year, province, month) %>%
# IV. Post-calculation checks:
  mutate(rH = ifelse(rH > 100, 100, rH)) %>%
  mutate_at(vars(aH, rH, Rf, Sh), funs(ifelse(. < 0, 0, .)))