In demographics, the centre of population (or population center, or population centroid) of a region is a geographical point that describes a centrepoint of the region’s population. See here for more detail. The figure below shows for example the change of the location of the population center of the USA from 1790 to 2010:

In this post we show how we can use population density raster data from the WorldPop project to calculate population centers of given polygons such as those provided by the GADM project. We will use Vietnam as a case study, first calculating the population center of the province of Hanoi and comparing it to the geometric barycenter. Then, we’ll introduce a pipeline that allows to calculate the population centers of all the provinces of Vietnam in one go.
The WorldPop data can be accessed directly from
the worldpopVN package. The
GADM data will be downloaded using the gadm() function of
the sptools package.
# install.packages(c("devtools", "sp", "raster", "rgeos", "magrittr", "dplyr", "purrr"))
# devtools::install_github("choisy/worldpopVN")
# devtools::install_github("choisy/sptools")
library(sp) # sp methods
library(raster) # raster methods
library(magrittr) # %>% The WorldPop data:
wp <- worldpopVN::getpop()Which gives:
plot(wp)
The provinces polygons from GADM:
gadm <- sptools::gadm("vietnam", "sp", 1)##
## Do you want to download it in your internal library ? (yes/ no) ?## ## Selection:
##
## Do you want to save the map in another location (yes/ no (default))## ## Selection:Which gives:
plot(gadm)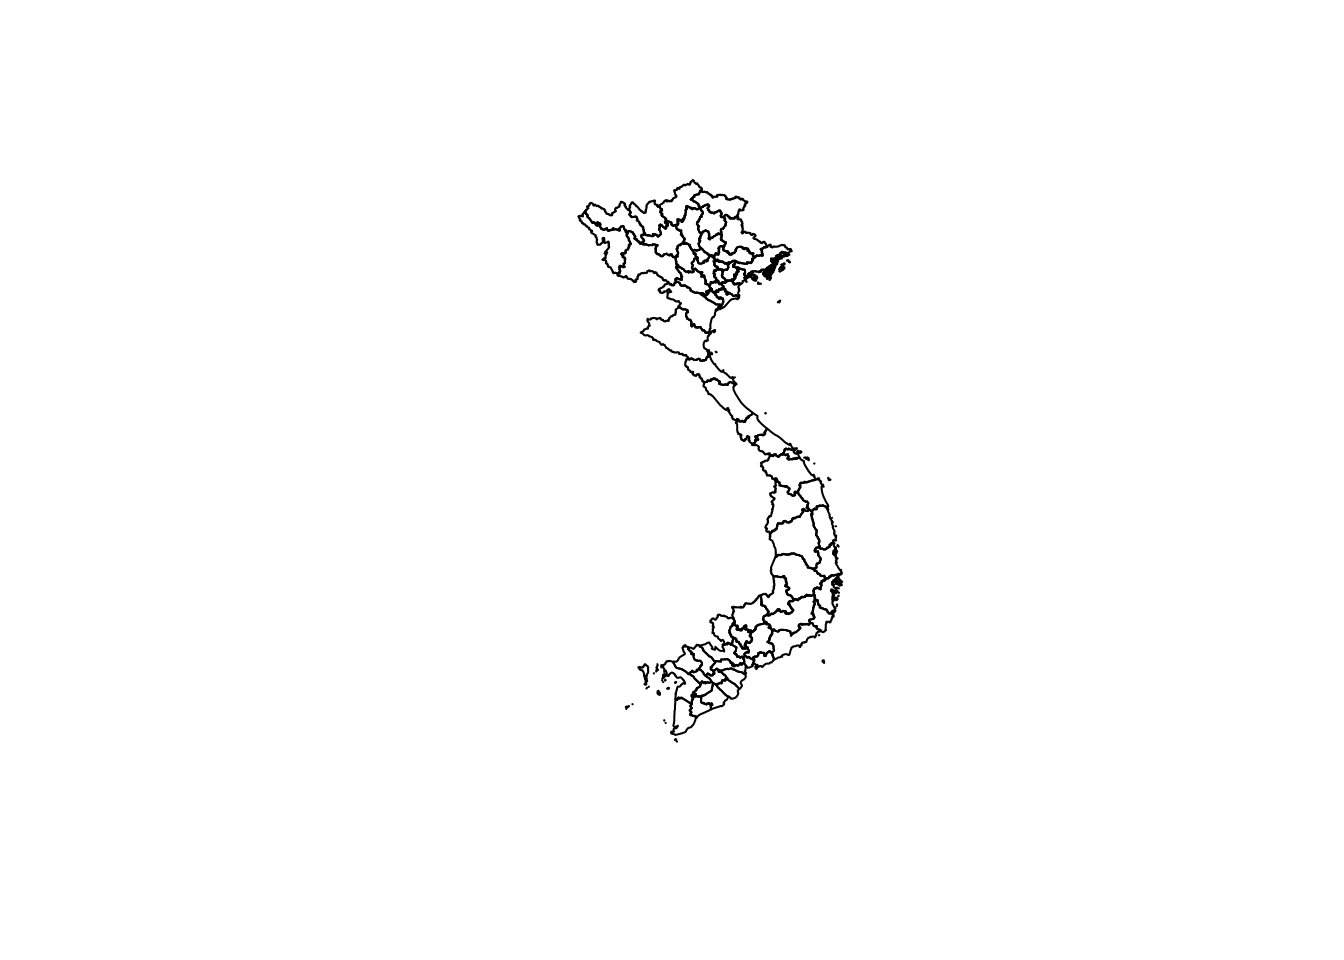
Let’s crop the raster data along the polygon of the province of Hanoi:
hanoi_polygon <- subset(gadm, VARNAME_1 == "Ha Noi")
hanoi <- sptools::crop_on_poly(wp, hanoi_polygon)
Which gives:
plot(hanoi)
From that, calculating the population center needs 2 steps:
- extracting the population values in each pixel and transforming them into weights (i.e. between 0 and 1 and summing to 1);
- extracting the coordinates of the center of each pixel and weight-summing the longitude and latitude values with the weights calculated in the first step.
Before these 2 steps, the raster need to be converted to a SpatialPointsDataFrame
object:
hanoi2 <- raster::rasterToPoints(hanoi, spatial = TRUE)The first step is:
values <- hanoi2@data[[1]]
weights <- values / sum(values)
The second step is:
pop_center <- hanoi2 %>%
  sp::coordinates() %>%
  as.data.frame() %>%
  lapply(. %>%
           `*`(weights) %>%
            sum()) %>%
  unlist()
For comparison, let’s compute the simple geometric barycenter from the polygon of Hanoi:
barycenter <- hanoi_polygon %>%
  rgeos::gCentroid() %>%
  sp::coordinates()
Let’s now compare the locations of the population center and the geometric barycenter:
plot(hanoi)
points(pop_center[1], pop_center[2], pch = 1) # circle
points(barycenter[1], barycenter[2], pch = 2) # triangle
A pipeline to calculate the population centers of all the provinces
Let’s now imagine that we want to calculate the coordinates of the population
centers of all the provinces of the gadm object. First, we’d need to include
the 2 steps of the centroid calculation into a function:
weighted_centroid <- function(spptdf) {
  require(sp)
  require(magrittr)
  weights <- spptdf %>% # step 1
    slot("data") %>%
    {. / sum(.)}
  spptdf %>%            # step 2
    coordinates() %>%
    as.data.frame() %>%
    lapply(. %>%
             `*`(weights) %>%
             sum()) %>%
    unlist()
}
Then, we can run the following pipeline. It takes about 10’ on a MacBook Pro,
the vast majority of that time being for the crop_on_poly() call.
pop_centers <- gadm %>%
  sptools::as_list() %>%
  parallel::mclapply(sptools::crop_on_poly, rstr = wp) %>%
  lapply(raster::rasterToPoints, spatial = TRUE) %>%
  lapply(weighted_centroid) %>%
  purrr::reduce(dplyr::bind_rows)