Packages needed
Install these packages if they are not already installed on your system, then load them:
> library(sp)        # plot, points, spsample
> library(purrr)     # map2
> library(dplyr)     # %>%, mutate
> library(rgeos)     # gIntersection
> library(raster)    # plot, buffer
> library(geosphere) # areaPolygon
We can compute statistics in buffer zones around specific points. For that we need spatial data in raster format. These data can be qualitative (e.g. land cover) or quantitative (e.g elevation or population size).
Defining buffers zone and their areas
Let’s choose 10 points (cases) at random inside the polygon of Vietnam. First the polygon of Vietnam:
> # devtools::install_github("choisy/gadmVN")
> # devtools::install_github("choisy/sptools")
> vn <- gadmVN::gadm(level = "country") %>% sptools::largest_polygons()
Let’s see that polygon:
> plot(vn)
Let’s now choose 10 random locations inside the polygon of Vietnam:
> set.seed(30101976) # for the purpose of the reproducibility here only
> nb <- 10
> cases <- spsample(vn, nb, "random")
Let’s see that:
> plot(vn)
> points(cases, pch = 3, col = "red")
Let’s now define buffer zones around these points with a radius of 20 km:
> radius <- 20000 # in meters
> buffers <- buffer(cases, radius, dissolve = FALSE)
Let’s see that:
> plot(vn, col = adjustcolor("blue", .05))
> plot(buffers, col = adjustcolor("red", .1), add = TRUE)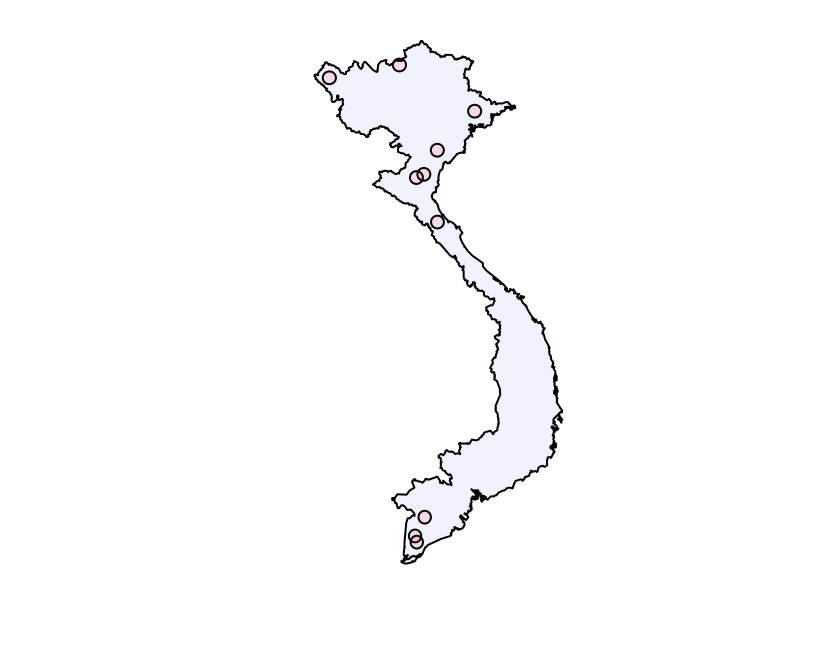
Note that the 8th of these buffers is crossed the border of Vietnam:
> plot(buffers[8], col = adjustcolor("red", .05))
> plot(vn, col = adjustcolor("blue", .1), add = TRUE)
> box(bty = "o")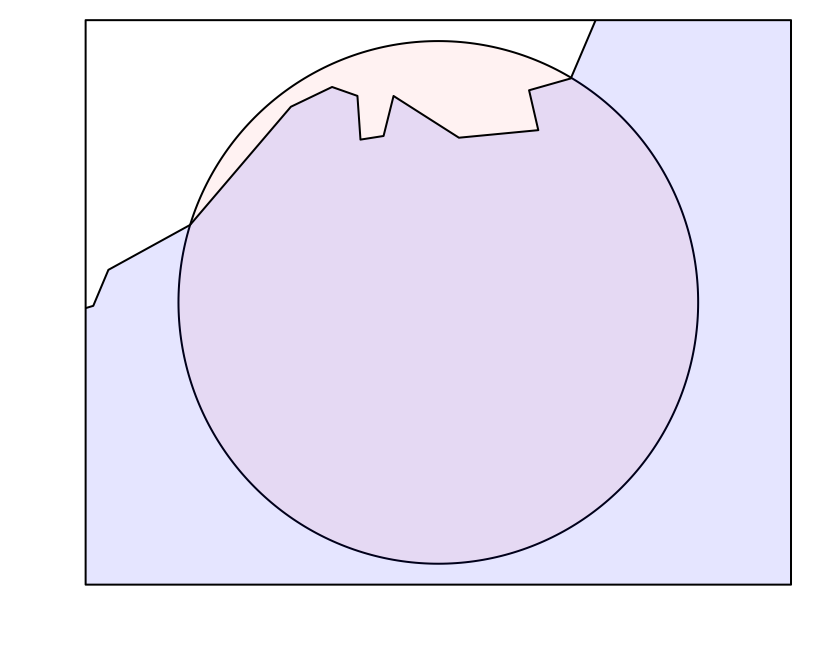
For that reason, we first need to compute the intersection of the buffers with the polygon of Vietnam before we can compute the areas of these buffers:
> (areas <- sapply(seq_along(buffers),
+                  function(x) areaPolygon(gIntersection(vn, buffers[x])) / 10^6))
 [1] 1256.572 1256.572 1256.572 1256.572 1256.572 1256.572 1256.572
 [8] 1143.787 1256.572 1256.572
Note that the area of the 8th buffer is slightly less that the areas of the other buffers.
Quantitative statistics
Let’s start we a quantitative example, looking at population size Vietnam:
> # devtools::install_github("choisy/worldpopVN")
> wpvn <- worldpopVN::getpop(2015)
The population size for Vietnam looks like this:
> plot(wpvn)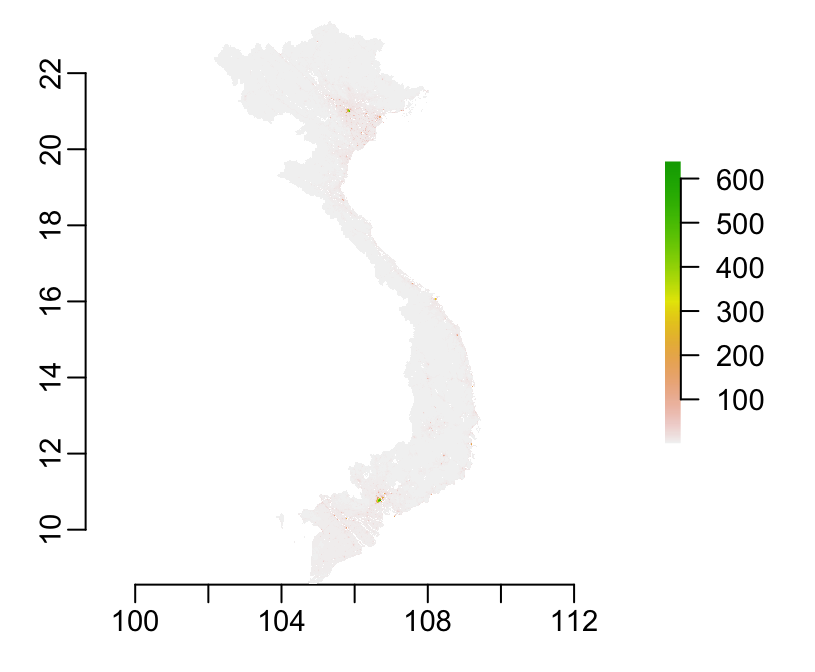
Let’s extract the values inside each buffers and sum them:
> (popsizes <- raster::extract(wpvn, cases, buffer = radius) %>% sapply(sum, na.rm = TRUE))
 [1] 107678.43  26090.01 117261.68 431477.35  89729.25 460979.95 337982.83
 [8]  78877.60 348799.43 510036.65
To get the population density (/ km2) in this buffer zones, we just need to divide this values by the areas:
> (densities <- popsizes / areas)
 [1]  85.69220  20.76284  93.31870 343.37648  71.40795 366.85512 268.97207
 [8]  68.96180 277.58009 405.89521
A pipeline version
Let’s describe here a pipeline version of the code above. Let’s imagine that we start from a matrix of coordinates:
> (coord_mat <- coordinates(cases))
             x         y
 [1,] 105.3766 19.604040
 [2,] 102.5897 22.341166
 [3,] 106.8751 21.394561
 [4,] 105.1687  9.175559
 [5,] 105.1582 19.513076
 [6,] 105.7741 20.287876
 [7,] 105.7781 18.250804
 [8,] 104.6568 22.703839
 [9,] 105.1182  9.350618
[10,] 105.4021  9.883708
The pipeline below used the above-defined objects radius, vn and wpvn, and
also the projection llCRS defined below:
> llCRS <- CRS("+proj=longlat +datum=WGS84 +no_defs +ellps=WGS84 +towgs84=0,0,0")Let’s now then define 2 utilitary functions:
> calc_area <- function(sp, radius, polygon) {
+   sp %>%
+     buffer(radius) %>%
+     gIntersection(polygon) %>%
+     areaPolygon()
+ }
and
> calc_popsize <- function(sp, radius, raster) {
+   raster::extract(raster, sp, buffer = radius) %>% sapply(sum, na.rm = TRUE)
+ }
Then, the pipeline goes:
> coord_mat %>%
+   data.frame %>%
+   mutate(sp      = map2(x, y, data.frame) %>% lapply(. %>% SpatialPoints(llCRS)),
+          area    = sapply(sp, calc_area, radius, vn),
+          popsize = sapply(sp, calc_popsize, radius, wpvn),
+          density = popsize / area) %>%
+   dplyr::select(-sp)
          x         y       area   popsize      density
1  105.3766 19.604040 1256572229 107678.43 8.569220e-05
2  102.5897 22.341166 1256572229  26090.01 2.076284e-05
3  106.8751 21.394561 1256572230 117261.68 9.331870e-05
4  105.1687  9.175559 1256572234 431477.35 3.433765e-04
5  105.1582 19.513076 1256572229  89729.25 7.140795e-05
6  105.7741 20.287876 1256572228 460979.95 3.668551e-04
7  105.7781 18.250804 1256572233 337982.83 2.689721e-04
8  104.6568 22.703839 1143786839  78877.60 6.896180e-05
9  105.1182  9.350618 1256572226 348799.43 2.775801e-04
10 105.4021  9.883708 1256572229 510036.65 4.058952e-04
A function version
We can put the above pipe into a function:
> buffering <- function(coord, radius, rast, polyg) {
+   require(sp)
+   require(purrr)
+   require(rgeos)
+   require(dplyr)
+   require(raster)
+   require(geosphere)
+   stopifnot(proj4string(rast) == proj4string(polyg))
+   coord %>%
+   data.frame %>%
+       mutate(sp      = map2(x, y, data.frame) %>% lapply(. %>% SpatialPoints(llCRS)),
+          area    = sapply(sp, calc_area, radius, vn),
+          popsize = sapply(sp, calc_popsize, radius, wpvn),
+          density = popsize / area) %>%
+   dplyr::select(-sp)
+ }
Using that function:
> buffering(coord_mat, radius, wpvn, vn)
          x         y       area   popsize      density
1  105.3766 19.604040 1256572229 107678.43 8.569220e-05
2  102.5897 22.341166 1256572229  26090.01 2.076284e-05
3  106.8751 21.394561 1256572230 117261.68 9.331870e-05
4  105.1687  9.175559 1256572234 431477.35 3.433765e-04
5  105.1582 19.513076 1256572229  89729.25 7.140795e-05
6  105.7741 20.287876 1256572228 460979.95 3.668551e-04
7  105.7781 18.250804 1256572233 337982.83 2.689721e-04
8  104.6568 22.703839 1143786839  78877.60 6.896180e-05
9  105.1182  9.350618 1256572226 348799.43 2.775801e-04
10 105.4021  9.883708 1256572229 510036.65 4.058952e-04
Qualitative statistics
Let’s see now how it works with qualitative variables such as land cover.
> gcvn <- globcoverVN::getgcvn()The plot of the land cover with the buffers:
> plot(gcvn)
> plot(buffers, add = TRUE)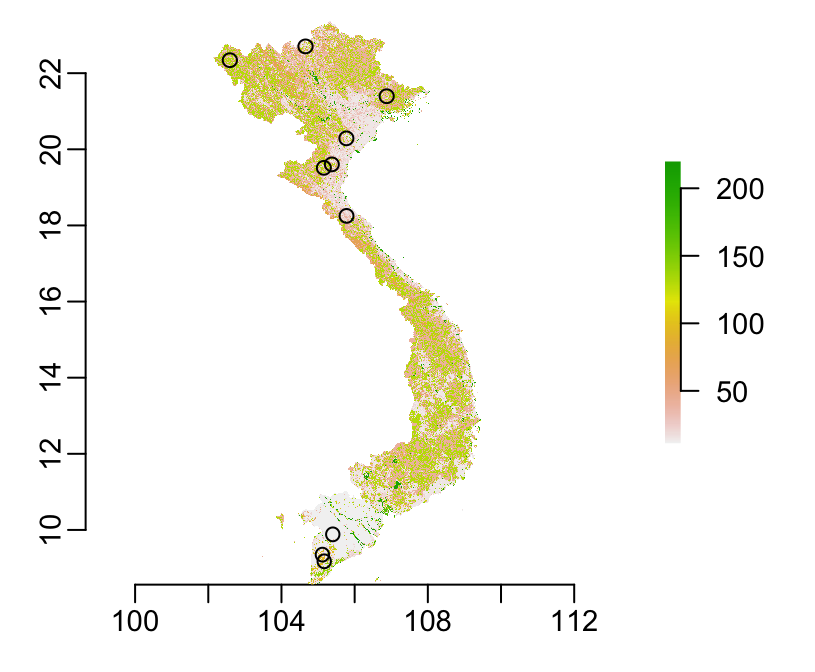
To see the legend:
> globcoverVN::show_legend(gcvn)
 11 : Post-flooding or irrigated croplands (or aquatic)
 14 : Rainfed croplands
 20 : Mosaic cropland (50-70%) / vegetation (grassland/shrubland/forest) (20-50%)
 30 : Mosaic vegetation (grassland/shrubland/forest) (50-70%) / cropland (20-50%)
 40 : Closed to open (>15%) broadleaved evergreen or semi-deciduous forest (>5m)
 50 : Closed (>40%) broadleaved deciduous forest (>5m)
 60 : Open (15-40%) broadleaved deciduous forest/woodland (>5m)
 70 : Closed (>40%) needleleaved evergreen forest (>5m)
100 : Closed to open (>15%) mixed broadleaved and needleleaved forest (>5m)
110 : Mosaic forest or shrubland (50-70%) / grassland (20-50%)
120 : Mosaic grassland (50-70%) / forest or shrubland (20-50%)
130 : Closed to open (>15%) (broadleaved or needleleaved, evergreen or deciduous) shrubland (<5m)
140 : Closed to open (>15%) herbaceous vegetation (grassland, savannas or lichens/mosses)
150 : Sparse (<15%) vegetation
160 : Closed to open (>15%) broadleaved forest regularly flooded (semi-permanently or temporarily) - Fresh or brackish water
170 : Closed (>40%) broadleaved forest or shrubland permanently flooded - Saline or brackish water
190 : Artificial surfaces and associated areas (Urban areas >50%)
200 : Bare areas
210 : Water bodies
220 : Permanent snow and ice
Magnifying the 8th buffer:
> plot(buffers[8])
> plot(gcvn, axes = FALSE, legend = FALSE, add = TRUE)
> plot(buffers[8], add = TRUE)
> plot(vn, add = TRUE)
> box(bty = "o")
We can calculate the percentage of land cover for each buffer by using this function:
> calc_globcov <- function(sp, radius, raster) {
+   raster::extract(raster, sp, buffer = radius) %>%
+     table() %>%
+     (function(x) lapply(list(I, sum), function(f) f(x))) %>%
+     do.call(`/`, .)
+ }
like this:
> coord_mat %>%
+   data.frame() %$%
+   map2(x, y, data.frame) %>%
+   lapply(. %>% SpatialPoints(llCRS)) %>%
+   lapply(calc_globcov, radius, gcvn) %>%
+   do.call(dplyr::bind_rows, .) %>%
+   mutate_all(funs(ifelse(is.na(.), 0, .))) %>%
+   bind_cols(data.frame(coord_mat), .)
          x         y           11          14          20          30
1  105.3766 19.604040 4.919085e-03 0.151778712 0.117915449 0.112497327
2  102.5897 22.341166 7.005254e-05 0.013450088 0.018704028 0.137933450
3  106.8751 21.394561 1.409145e-04 0.043331220 0.035510463 0.113577115
4  105.1687  9.175559 1.401806e-01 0.353362693 0.110920355 0.042024334
5  105.1582 19.513076 6.563459e-03 0.072269387 0.095312834 0.136405793
6  105.7741 20.287876 1.774182e-03 0.315662480 0.147044213 0.176424668
7  105.7781 18.250804 5.657393e-02 0.137085759 0.387966358 0.109553591
8  104.6568 22.703839 4.442395e-02 0.234186458 0.059026977 0.187303051
9  105.1182  9.350618 3.326118e-01 0.282078077 0.050832276 0.020526984
10 105.4021  9.883708 9.902377e-01 0.001341382 0.001192339 0.001490424
             40           60          70         100          110
1  0.1982604976 0.0015684038 0.006344906 0.052612818 0.0003564554
2  0.2245884413 0.0274605954 0.038178634 0.004483363 0.0000000000
3  0.3569365180 0.0000000000 0.011836821 0.072359614 0.0000000000
4  0.0007464358 0.0002985743 0.032693887 0.193998656 0.0051504068
5  0.2074623671 0.0019975744 0.006706143 0.064493116 0.0010701291
6  0.1425732737 0.0051096445 0.015754737 0.019799872 0.0003548364
7  0.2452016390 0.0000000000 0.009920207 0.006972899 0.0055351880
8  0.1382676197 0.0024594574 0.117900238 0.001383445 0.0056106372
9  0.0035082481 0.0010450101 0.047622602 0.205269837 0.0063447040
10 0.0004471272 0.0005216484 0.000000000 0.000000000 0.0000000000
           130         140          210          50          120
1  0.343052684 0.003635845 0.0070578171 0.000000000 0.0000000000
2  0.520490368 0.000000000 0.0000000000 0.014360771 0.0002802102
3  0.366095963 0.000000000 0.0002113718 0.000000000 0.0000000000
4  0.012316190 0.086437262 0.0000000000 0.002388594 0.0194819736
5  0.407576514 0.000000000 0.0001426839 0.000000000 0.0000000000
6  0.151444184 0.015754737 0.0064580229 0.000000000 0.0009225747
7  0.013802027 0.007691755 0.0196966429 0.000000000 0.0000000000
8  0.193912843 0.003228038 0.0000000000 0.011144416 0.0007685804
9  0.014032992 0.013734418 0.0000000000 0.001866089 0.0205269837
10 0.004471272 0.000000000 0.0002980848 0.000000000 0.0000000000
            200          150
1  0.0000000000 0.0000000000
2  0.0000000000 0.0000000000
3  0.0000000000 0.0000000000
4  0.0000000000 0.0000000000
5  0.0000000000 0.0000000000
6  0.0009225747 0.0000000000
7  0.0000000000 0.0000000000
8  0.0002305741 0.0001537161
9  0.0000000000 0.0000000000
10 0.0000000000 0.0000000000