A great function to generate palettes of colors is colorRampPalette from the
grDevices package. This function takes a set of colors as argument and returns
a function similar to grDevices::heat.colors and others that generates a
palette of n contiguous colors, n being an argument of this function. The
generation of the palette of colors is done by interpolation (spline or linear)
and a good starting points for interpolation are the “sequential” and
“diverging” palettes generated by RColorBrewer::brewer.pal (the limitation
of RColorBrewer::brewer.pal being that the number of colors it can generate is
limited to 9 maximum).
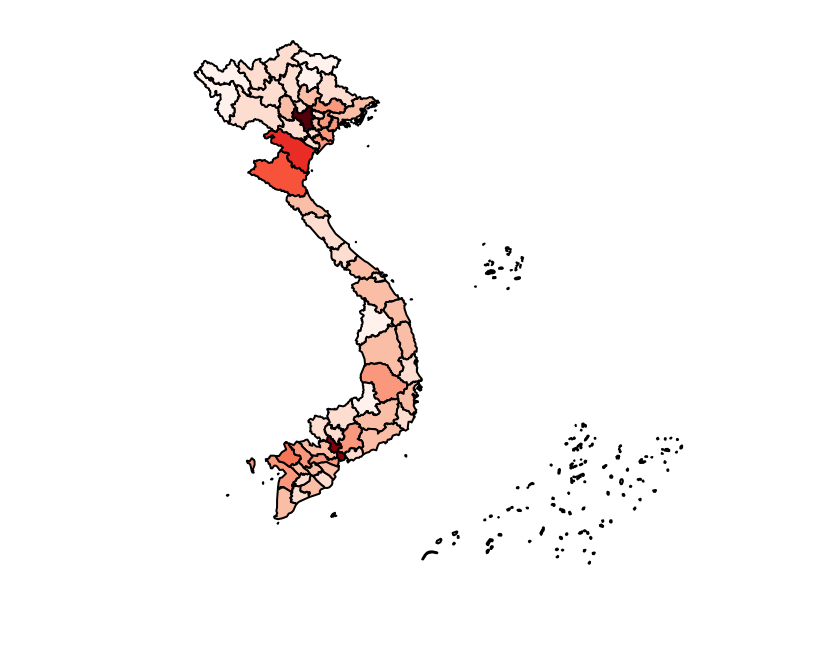
Let’s see an example plotting the population size of Vietnamese provinces. We
want 11 sequential red colors but the maximum number of colors for the color set
Reds in RColorBrewer is 9. The trick thus is to interpolate these 9 colors
generated by RColorBrewer::brewer.pal to 11 using grDevices::heat.colors:
> (intial_colors <- RColorBrewer::brewer.pal(9, "Reds"))
[1] "#FFF5F0" "#FEE0D2" "#FCBBA1" "#FC9272" "#FB6A4A" "#EF3B2C" "#CB181D"
[8] "#A50F15" "#67000D"
> color_generator <- colorRampPalette(intial_colors)
> (color_palette <- color_generator(11))
 [1] "#FFF5F0" "#FEE4D8" "#FCC9B4" "#FCAA8E" "#FB8A69" "#FB6A4A" "#F14431"
 [8] "#D92522" "#BB1419" "#980B13" "#67000D"
Note that the first and last colors of the initial_colors and color_palette
palettes are necessarily the same since color_palette is generated from
intial_colors by interpolation. Once the palette of colors is generated, we
can use it to draw our map:
> library(magrittr)
> library(sp)
> # devtools::install_github("choisy/censusVN2009")
> data("provinces", package = "censusVN2009")
> provinces$population %>%                   # divide population size by 100,000
+   cut(10^5 * seq(0, 55, length = 12)) %>%  # cuts into 11 categories
+   as.integer() %>%                         # transforms into integer
+   `[`(color_palette, .) %>%                # used as the index of color_palette
+   plot(provinces, col = .)                 # to generate the color vector for the plot